◆ PayGuardGitHub ↗
PUBLIC DASHBOARD / VERIFIED DEMONSTRATION

Watch recovery happen.

Explore a provider timeout and its resolution. The scenario is an educational replay of behavior verified in GitHub Actions; the linked CI run is the executable proof.

ACTUAL HOSTED MONITORING

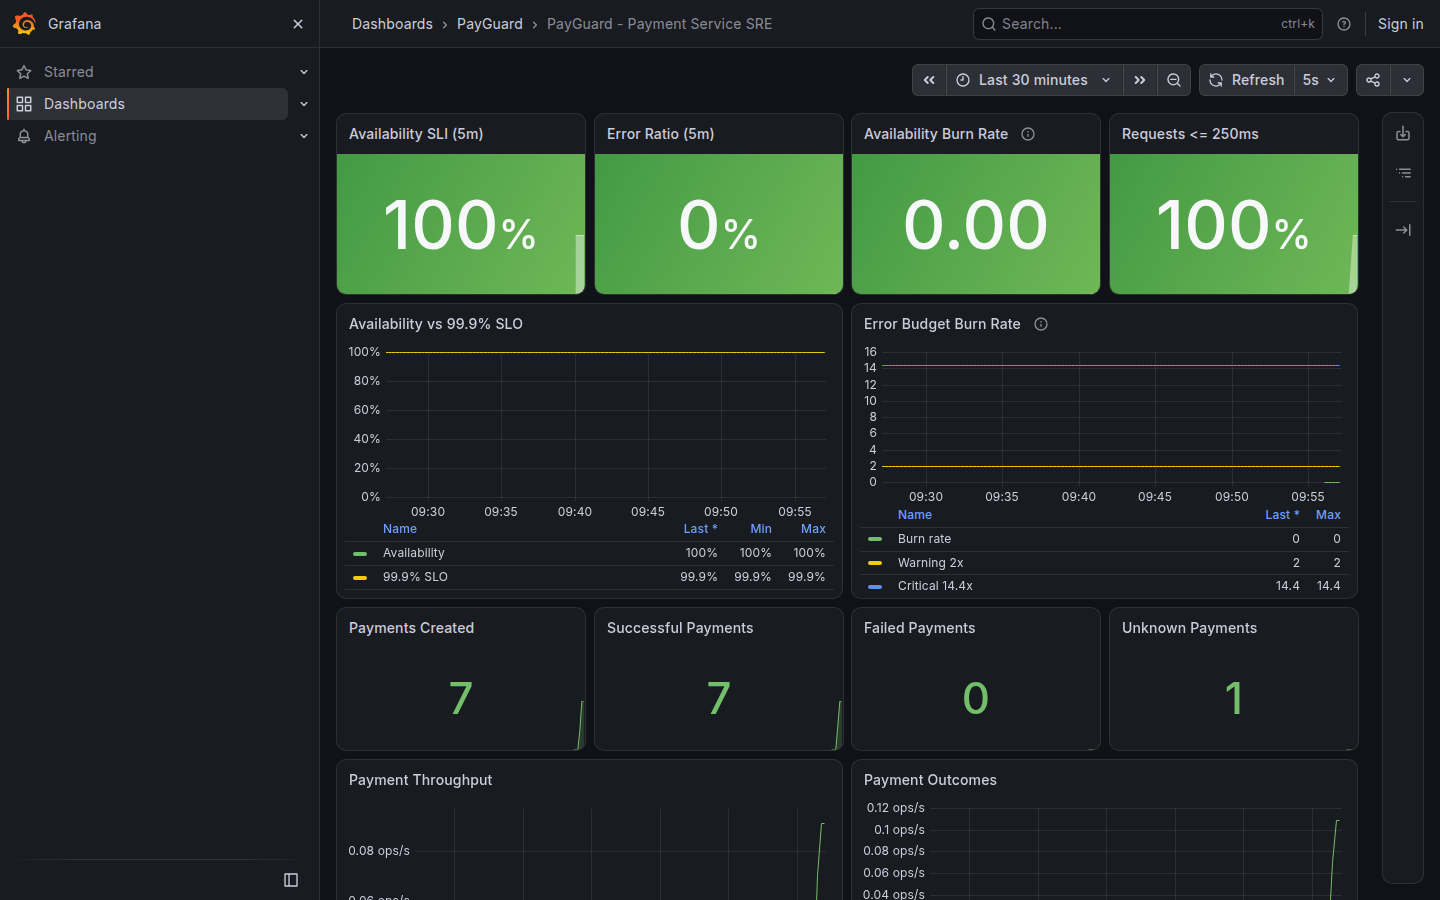
Grafana and Prometheus output, captured online.

A GitHub runner starts the real monitoring stack daily, queries Prometheus, and captures the provisioned Grafana dashboard. The result is hosted on GitHub Pages with a UTC timestamp, so visitors can view it without your laptop.

Real Grafana PayGuard dashboard captured by a GitHub runner

This is a dated capture. The runner shuts down after publishing; it does not expose a continuously running Prometheus server.

01 / PAYMENT SCENARIO

One payment. No duplicate charge.

SELECTED STEP

Client sends payment

The client POSTs a payment with an Idempotency-Key. That key identifies this logical payment across retries.

PAYMENT STATENEW REQUEST
POST /api/v1/payments
Idempotency-Key: DEMO-TIMEOUT-...
{ "customerId": "CUSTOMER-DEMO", "amount": 149900, "currency": "INR" }
WHAT TO NOTICE

The key belongs to the payment attempt, not to a single HTTP connection.

Verified on a GitHub runnerHealth UP · normal SUCCESS · timeout UNKNOWN · same ID on retry · reconciled SUCCESS · metrics exposed.Read run summary ↗

These controls replay the documented behavior locally in your browser. They do not send a payment or query a live production API.

02 / MONITORING PANELS

Ask the right operational questions.

AVAILABILITY SLI

Are payment requests succeeding?

Prometheus records a five-minute ratio and compares it with a 99.9% availability objective.

payguard:sli_availability:ratio5m
ERROR BUDGET

How fast is it burning?

The burn rate relates observed error ratio to the allowed 0.1% error budget. Warning and critical rules evaluate it.

payguard:slo_availability:burn_rate5m
LATENCY SLI

Are requests fast enough?

A five-minute ratio tracks responses within 250 ms; the latency alert evaluates a 99% threshold.

payguard:sli_latency_250ms:ratio5m
LOGS AND RECOVERY

What happened to this payment?

Alloy ships scoped PayGuard logs to Loki. Provider and reconciliation events help explain the UNKNOWN → SUCCESS transition.

provider_timeout_after_success

Learn the monitoring terms → · Inspect actual Prometheus rules ↗

03 / ACTUAL OUTPUTS

Proof, source, and local live views.

See the latest captured Prometheus queries and Grafana dashboard ↗. The GitHub runner refreshes this dated evidence daily.

CI status

Java CI workflow badge Reliability demo workflow badge

The badge shows the latest workflow outcome. The run page contains a summary and a downloadable evidence artifact.

Open recent runs ↗

Public visitors can use the interactive replay and hosted CI results. localhost links refer to each visitor’s own computer and require PayGuard to be running there.