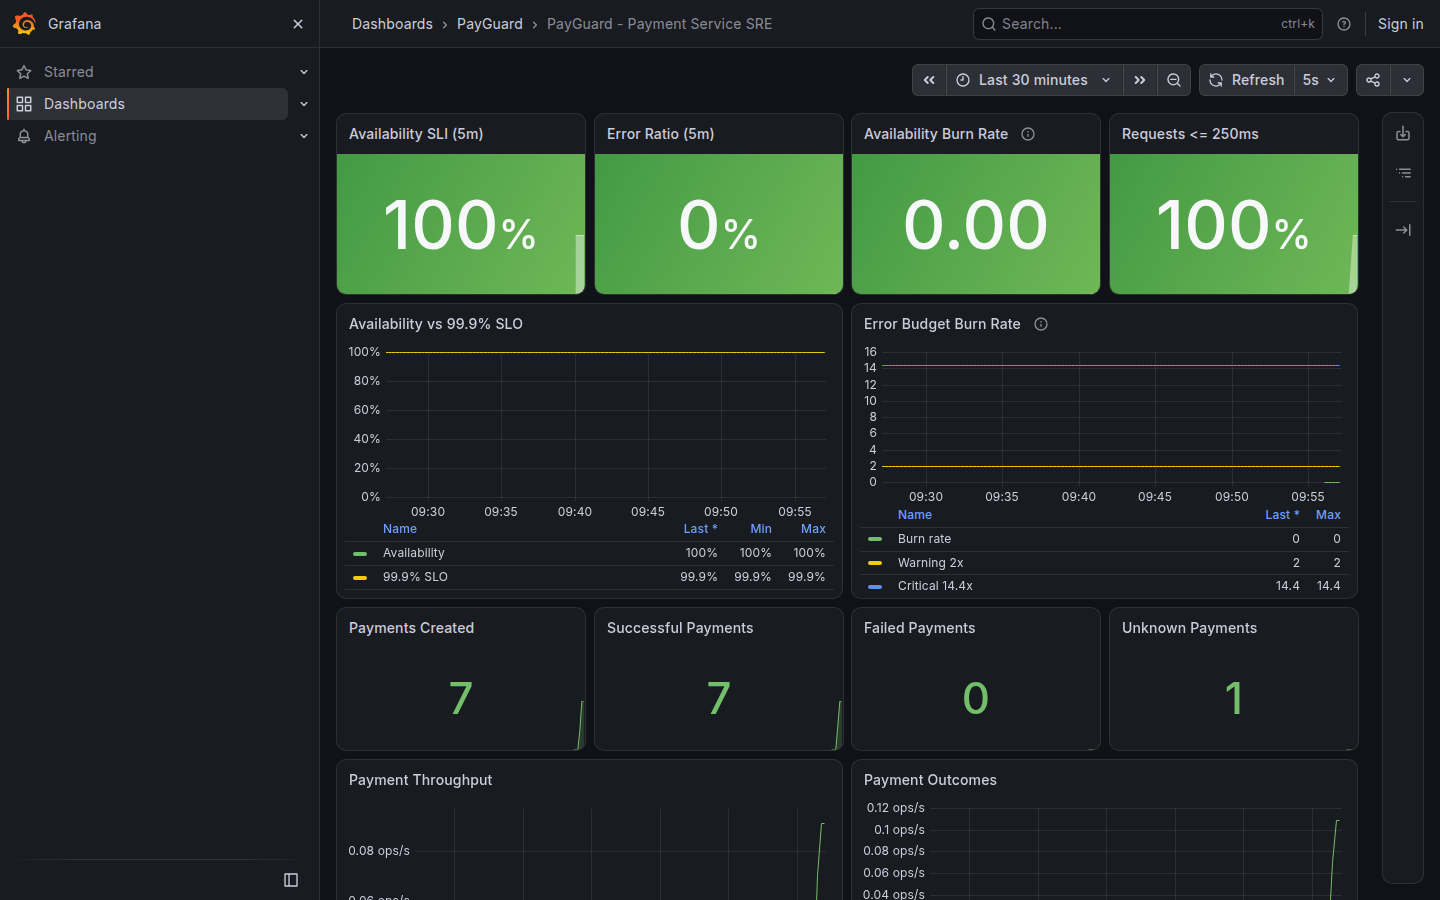
ACTUAL PROMETHEUS / GITHUB RUNNER
Captured monitoring evidence.
Captured 2026-11-13T09:56:48+00:00. The GitHub runner started the real API, Prometheus, and Grafana, then exported these readings. This is a dated capture, not a continuously running server.
Payment service scrape target: UP
9 recording and alerting rules loaded.
Prometheus instant queries
| Signal | PromQL | Observed value |
|---|---|---|
| Availability SLI (5m) | payguard:sli_availability:ratio5m | 1 |
| Error ratio (5m) | payguard:sli_error:ratio5m | 0 |
| Error budget burn rate | payguard:slo_availability:burn_rate5m | 0 |
| Requests within 250 ms | payguard:sli_latency_250ms:ratio5m | 1 |
| Payments created | payguard_payment_total | 7 |
Actual Grafana dashboard capture
Rendered by the real Grafana instance on the same runner after Prometheus scraped the API.